Content marketing obviously depends on having something to publish, but how much content should you actually be producing? A recent experiment run by Hubspot and Moz tested just that and they got some interesting results.
The Experiment
The goal of this experiment by HubSpot and Moz was to see what the effects of frequency of content were on their traffic and leads. They designed a multi-phase approach:
- Benchmark - a 2-week period where they collected the average number of posts of each type they would normally post.
- High-Volume - a 2-week period where they published 1.5x the normal number of posts.
- Low-Volume - a 2-week period where they published .5 the normal number of posts.
To determine the effects, they measured the views of only these new posts. Moz gets only 10-15% of their traffic from the recent week's posts, and HubSpot gets only 25% of their traffic from current posts.
Each company also measured a few other factors, which we will cover below.
HubSpot's Test
HubSpot produces a lot of content as part of their inbound marketing strategy with a large in-house team. During their 2-week benchmarking period, they published an average of 23 posts per week.
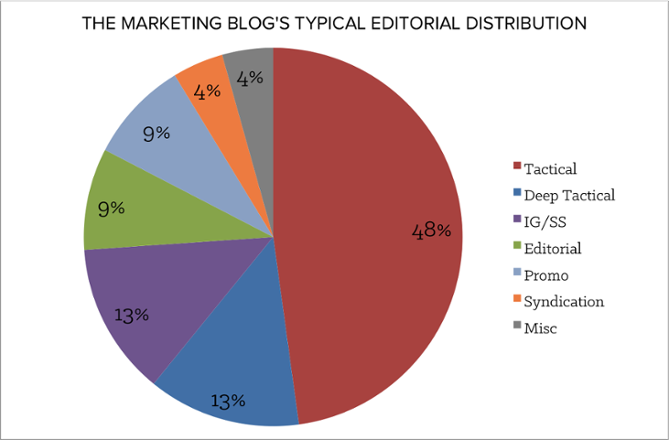
HubSpot classifies their posts in the following categories:
- Tactical - shorter, high level, how-to posts.
- Deep Tactical - longer (1,500 words), with in-depth data, and original quotes.
- Infographic/SlideShare - focused more on graphics, less text
- Editorial - about a marketing trend, with interviews, original info. Maybe no takeaways
- Promo - promote a gated offer
- Syndications - externally produced and reposted
- TOFU - targeted to current internet trends
During their benchmark week, their content mix looked like this:

High Volume Phase - 5% more traffic, 90% more leads, more churn
During their High Volume phase, they focused more on the Low Comprehensiveness types - more Infographics, Promo and Tactical posts. They published 34.5 posts/week.
This resulted in only a 5% increase in traffic - people can only consume so much content. However, they got almost double the leads, with a lower conversion rate, but at a much higher volume.
HubSpot's blog subscriber list had a lot of churn during this week. They have an Instant Subscription, which sends out an email as soon as a new post is published, and the increased volume was too much for some people.
Low Volume Phase - 32% less traffic, 4% fewer leads, no churn
During their Low Volume phase, they focused more on Deep Tactical and Editorial posts, and less on Tactical and Infographics. They published 11.5 posts/week.
Email and social dropped significantly as a source of traffic - the fewer the number of posts, the fewer shares and links to click on. They got more conversions per post, but it couldn't make up for lost traffic.
HubSpot's Conclusions
Even though they got more leads with the High Volume phase, the amount of effort required to create them wasn't worth it. While the conversion rate of the higher comprehension posts in the Low Volume phase was better, the traffic was just too low to be worth while. So, HubSpot is going to retain their current benchmark-level of posting.
Moz's Test
Moz has a smaller team and generally publishes one post a day, with Fridays reserved for their Whiteboard Friday videos. During their experiment, they decided to leave Fridays alone and just vary the number of posts on Monday-Thursday.

High Volume Phase - no real effect on traffic
Doubling the publishing volume didn't really affect the overall unique page views. This is likely because people just don't have time to read more than one Moz post/day. Their audience is more specialized than HubSpot's and their content more focused.
Their engagement metrics went down per post. With twice as many posts, users didn't spend twice as much time commenting, but instead were pickier about which posts they commented on.
Low Volume Phase - 5.6% drop in unique page views
A concern was that users would be unhappy about fewer posts, but there was little reaction. The overall number of comments during this phase stayed the same as during the benchmark. The Moz team also found that they didn't actually get to spend more time writing deeper posts, but instead invested that time into other productive aspects of their business.
Moz's Conclusions
Moz realized the artificial schedule of posting 1/day wasn't critical to their success. While it is still a good overall goal, they were willing to miss a day if it meant putting out better quality content or working other critical company areas. So, they will continue to shoot for the benchmark schedule, but be more flexible.
Takeaways
So, what should you do based on this?
- Find your own benchmarks. How many posts per week are you doing on average now? What is your average traffic level, engagement, and conversion rate per post?
- Increase your output. Do a 2-week test where you publish up to twice as much content. Perhaps you can reuse/update some older posts that are still relevant to make up the difference.
- Decrease your output. Do a 2-week test where you publish only high-value content, but less frequently.
- Run the numbers. Measure the effects of each test - conversion rate/post, weekly traffic, and engagement/post. Look at where your traffic came from - social, direct, referral, search - and see how those platforms changed with the tests.
- Update your "normal". Based on the data, see whether making a change to the normal schedule makes sense. Look at how much effort it takes to publish a post versus the value each additional post brings in. Also, like Moz, see if the extra time from a lower volume schedule can be put to better use elsewhere.
Stay tuned for the followup to this article on the most effective content mix.
Tags:
Content MarketingAug 12, 2015


